
Bitcoin fights to hold $112K support as massive ETF outflows signal institutional retreat amid September’s continued crypto market weakness
The Battle for $112K
As Wednesday trading unfolds, Bitcoin clings to $112,277 a modest 0.24% recovery that represents far more than its small percentage gain suggests. After Monday’s devastating $1.5 billion liquidation cascade, this narrow trading range between $111,460 and $112,504 has become cryptocurrency’s most watched battlefield, where bulls and bears determine whether September’s notorious weakness continues or finally exhausts itself.
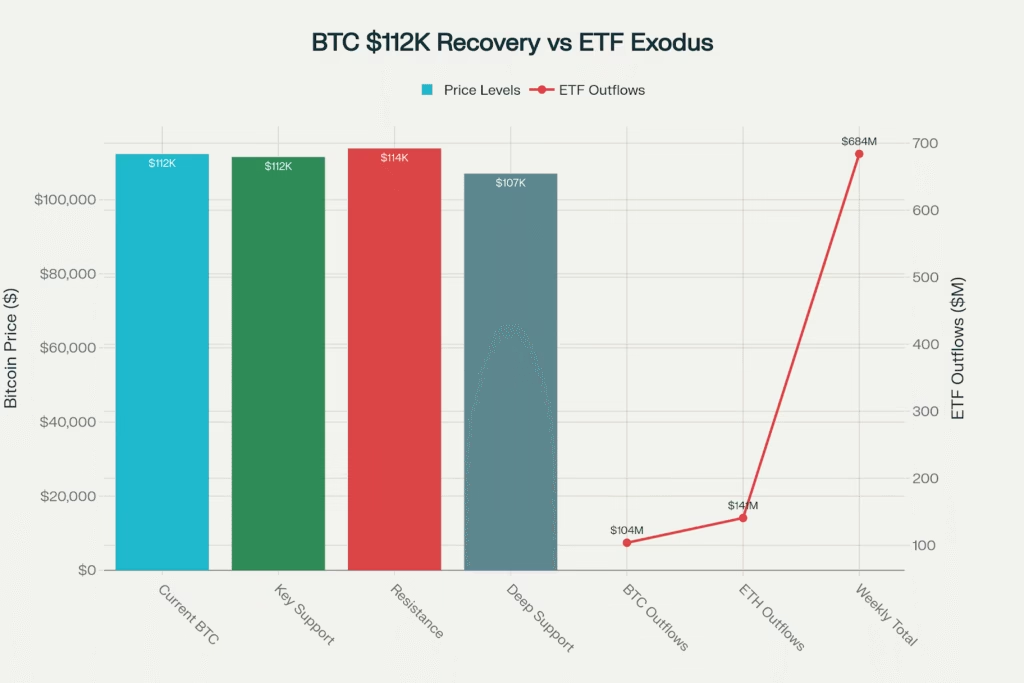
The broader market tells a sobering story: total cryptocurrency market capitalization has shrunk to approximately $3.88 trillion, while the Fear & Greed Index has plummeted to 42, firmly entrenched in “fear” territory. Most troubling for institutional adoption narratives, Bitcoin and Ethereum ETFs have hemorrhaged $684 million in outflows this week alone, signaling the most severe institutional retreat since these products launched.
Bitcoin attempts recovery at $112K support while battling historic $684M ETF outflow exodus as September’s crypto curse shows no mercy
Current Market Snapshot:
- Bitcoin: $112,277 (+0.24% attempting recovery from $111K lows)
- Market Cap: $3.88 trillion (down from $4.14T peak just days ago)
- ETF Outflows: $684M combined weekly exodus from BTC/ETH funds
- Sentiment: Fear & Greed Index at 42 (deep fear territory)
- September Performance: Living up to historical -4.5% average decline
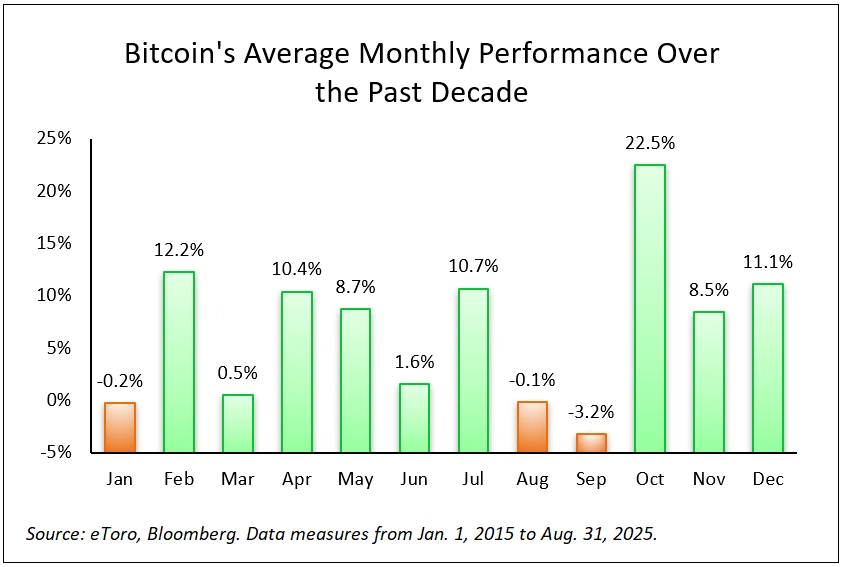
Bitcoin’s average monthly performance over the past decade reveals September as a consistently weak month for the cryptocurrency investing
The Great ETF Exodus, Institutional Confidence Cracks
The magnitude of institutional capital flight cannot be understated. On Tuesday alone, Bitcoin ETFs recorded $103.8 million in net outflows, led by Fidelity’s FBTC fund losing $75.55 million nearly triple the size of most funds’ daily volumes. Ethereum ETFs fared worse, posting $140.8 million in outflows with zero inflows across all nine products.
This institutional retreat marks a dramatic reversal from the euphoric $2+ billion weekly inflows witnessed just two weeks ago following the Federal Reserve’s rate cut. The speed of this reversal suggests institutional investors are reassessing both crypto’s role in portfolios and the effectiveness of Fed easing in supporting risk assets.
ETF Outflow Breakdown:
- Bitcoin ETFs: $103.8M single-day exodus (September 23)
- Ethereum ETFs: $140.8M across all products
- Fidelity Leadership: FBTC leads with $75.55M withdrawal
- Weekly Damage: $684M combined outflows BTC+ETH ETFs
- Institutional Signal: Serious demand deterioration short-term

3D illustration of a Bitcoin coin with the letters ‘ETF’ symbolizing Bitcoin Exchange Traded Funds tradingnews
The ETF data reveals sophisticated money reducing crypto exposure precisely when technical support levels are being tested a pattern that suggests institutional positioning for potentially deeper declines rather than buying opportunities.
Technical Analysis
From a technical perspective, Bitcoin’s current positioning represents a critical inflection point. The cryptocurrency is testing support in the $111,000-$112,000 zone that has emerged as make or break territory following Monday’s liquidation cascade. This level coincides with both psychological significance and technical retracement levels from Bitcoin’s recent advance.
According to Hyblock Capital’s liquidity analysis, the deepest buy and sell order clusters sit at $107,000 a level that could act as a powerful magnet for price action if current support fails. However, encouraging signs include 73,702 BTC accumulated by new wallets over the past month, suggesting some fresh demand despite institutional selling.

Bitcoin daily price chart with technical analysis of support and resistance levels near $112K and below, with RSI momentum indicator shown cryptonary
Critical Technical Levels:
- Immediate Support: $111K-$112K (current battleground)
- Major Support: $107K (deepest liquidity cluster according to Hyblock)
- Recovery Targets: $114.8K immediate, $117K-$118K major resistance
- Pattern Recognition: Potential double bottom if $111K holds
- Volume Analysis: Elevated but showing signs of exhaustion
Social media sentiment analysis reveals “buy the dip” mentions spiking recently, suggesting retail investors view current levels as attractive entry points. This retail optimism contrasts sharply with institutional selling, creating typical late cycle divergence patterns.
Altcoin Divergence
While Bitcoin struggles with institutional selling, altcoin markets display stark divergence that provides insights into sector specific strength and weakness. ASTER emerged as Wednesday’s standout performer with a remarkable 23.78% surge, driven by its perpetual futures exchange surpassing Hyperliquid in 24-hour volume with $11.8 billion in activity.
BNB continues its remarkable run, setting new all-time highs above $1,080 (+2.36% daily) and demonstrating the Binance ecosystem’s resilience amid broader market turmoil. This strength reflects both CZ’s continued influence and the BNB Chain’s growing DeFi activity.
Altcoin Performance Spectrum:
- ASTER: +23.78% (perpetual futures volume explosion)
- BNB: New ATH $1,080 (+2.36% ecosystem strength)
- XRP: $2.87 (+0.64% showing relative resilience)
- Ethereum: $4,176 (-0.67% approaching $4K danger zone)
- Solana: $210.44 (-4.04% continued ecosystem pressure)

3D illustration of the letters ‘ETF’ with a large Bitcoin symbol coin representing Bitcoin exchange-traded funds tradingnews
The mixed altcoin performance suggests that while broad market sentiment remains negative, specific narratives around exchange tokens, DeFi infrastructure, and payment solutions continue attracting capital during this consolidation period.
September’s Revenge
Bitcoin’s current weakness aligns perfectly with historical September patterns that have plagued cryptocurrency markets for years. Over the past decade, September has averaged -4.5% returns for Bitcoin, with the 2019-2022 period showing particularly brutal -8.74% average declines during this month.
The “September effect” in crypto markets stems from multiple factors: institutional rebalancing at quarter end, tax loss harvesting preparations, and general risk-off sentiment as summer optimism fades. What makes 2025’s September particularly concerning is how it’s playing out despite Fed easing and institutional ETF infrastructure that many hoped would dampen seasonal volatility.
September Seasonality Impact:
- Historical Average: -4.5% September returns over past decade
- Brutal Period: 2019-2022 averaged -8.74% September losses
- Current Performance: Living up to “September curse” reputation
- Market Psychology: Fear dominance replacing summer optimism
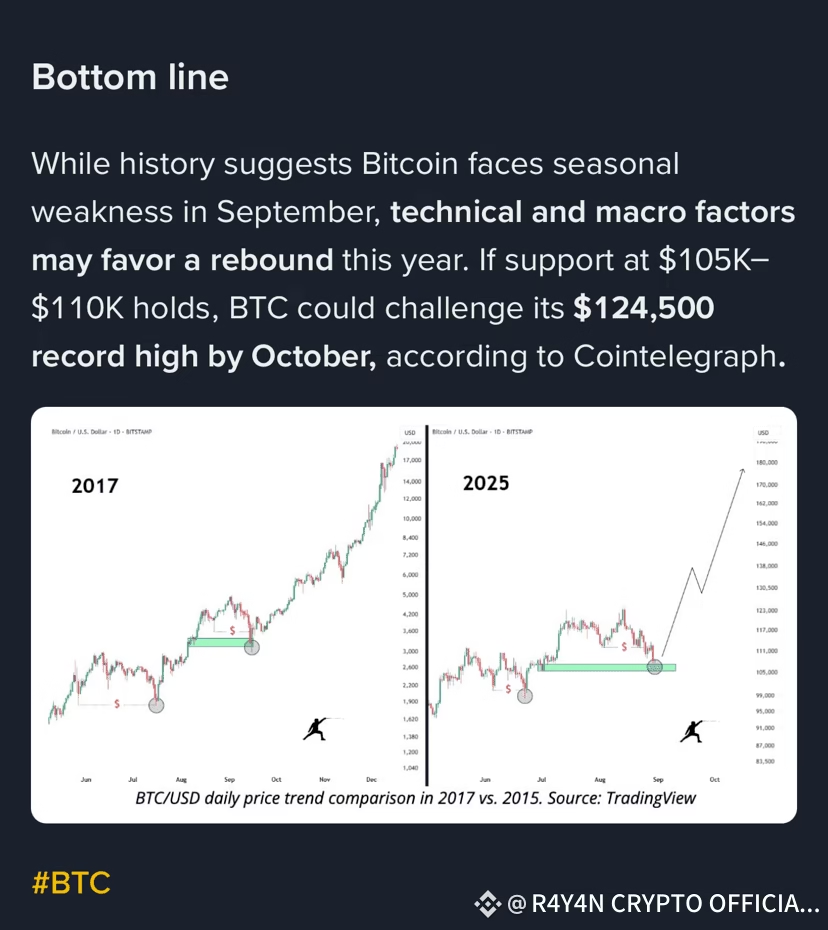
Bitcoin price trend comparison between 2017 and projected 2025 highlights potential rebound after seasonal September weakness and possible new record highs binance
However, historical analysis also shows that October has often provided strong rebounds following September weakness, with some years delivering explosive gains that more than compensate for autumn declines. The question becomes whether this pattern holds in an era of increased institutional participation.
Institutional vs Retail
Current market dynamics reveal a fascinating divergence between institutional and retail investor behavior. While ETF outflows demonstrate professional money reducing exposure, retail sentiment indicators suggest individual investors view current weakness as buying opportunities rather than reasons for panic.
Michael Saylor’s continued bullish commentary, predicting Bitcoin will “move up smartly again toward the end of the year,” represents the institutional Bitcoin maximalist position that current weakness is temporary consolidation before Q4 strength. However, the MicroStrategy chairman’s optimism contrasts sharply with broader institutional selling evident in ETF flows.
Institutional vs Retail Signals:
- Corporate Holdings: Still above $200B across 190+ entities
- Saylor Outlook: Bullish Q4 predictions despite current weakness
- Retail Sentiment: “Buy the dip” trending across social platforms
- Professional Money: ETF outflows suggest risk reduction
- Long-term Holders: Some distribution occurring at these levels
This divergence often precedes major market moves, though determining direction requires watching which group proves more prescient as conditions evolve.
Fed Policy and Macro Conditions
Federal Reserve Chair Jerome Powell’s recent comments emphasizing labor market stability over aggressive inflation control have created mixed signals for crypto markets. While markets interpret this as supporting additional rate cuts, the dollar’s continued strength and rising yields create headwinds for risk assets.
The cryptocurrency market’s relationship with traditional macro factors has evolved significantly, with Bitcoin now showing higher correlation to tech stocks and bonds than many anticipated. This integration means crypto cannot escape broader financial market dynamics, regardless of adoption narratives.
Macro Environment Assessment:
- Powell’s labor market priority suggests more rate cuts likely
- Dollar strength continues pressuring cryptocurrency valuations
- Treasury yields remaining elevated despite Fed dovishness
- Risk asset correlations limiting crypto’s independent movement
Recovery Requirements
Bitcoin’s ability to sustain recovery from current levels depends on several critical factors. First, the $112,000 support zone must hold decisively any breakdown toward $107,000 could trigger additional liquidations and test longterm holder resolve. Second, ETF outflows must slow and eventually reverse, as continued institutional selling creates persistent overhead pressure.
Volume patterns suggest current consolidation may be reaching resolution, with elevated trading activity indicating position adjustments rather than panic selling. If Bitcoin can reclaim and hold above $114,000, it would signal that September’s seasonal weakness may be concluding.
Recovery Checklist:
- Hold $112K support zone decisively
- ETF outflows must slow or reverse direction
- Volume confirmation required on any breakout attempts
- Fed policy remaining supportive for risk assets
- Institutional confidence restoration over time
The coming days will likely determine whether Bitcoin’s current stabilization represents genuine accumulation or merely a pause before additional weakness. With over $23 billion in options having expired last Friday, some technical pressure has been removed, potentially creating conditions for more sustainable price action.
Testing Crypto’s Institutional Thesis
Bitcoin’s battle at $112,000 represents more than technical support it’s testing cryptocurrency’s evolution from speculative asset to institutional portfolio component. The $684 million weekly ETF exodus challenges narratives about permanent institutional adoption, while persistent corporate holdings and retail interest suggest underlying demand remains intact.
September’s continued weakness validates historical seasonal patterns while highlighting that even institutional infrastructure cannot eliminate all cryptocurrency volatility. However, the speed and magnitude of recent declines may also be setting up conditions for the sharp October rebounds that have characterized previous cycles.
As Bitcoin attempts recovery from current levels, investors must balance technical analysis with institutional flow data, seasonal patterns with structural adoption trends. The resolution of this $112,000 battleground will likely determine not just near term price action, but the broader trajectory of cryptocurrency markets through year end 2025.
Market Status Update:
- Bitcoin: $112,277 (+0.24% recovery attempt from $111K lows)
- ETF Crisis: $684M weekly outflows signal institutional retreat
- Market Psychology: Fear & Greed Index at 42 (fear territory)
- Technical Battle: $112K support vs $107K major liquidity cluster
- September Effect: Continuing historical weakness patterns into final week
Related Coverage:
- $4.8B Options Expiry Shakes Crypto Markets as BNB Hits $900 ATH and Whale Rotates $75M to Ethereum
- CPI Data Could Determine Crypto’s $4 Trillion Milestone
- PayPal Expands P2P Payments With Bitcoin and Ethereum
- Weekend Crypto Alert: XRP Rockets Into Top-100 Global Assets as Record $220B Liquidation Risk Threatens Markets