
Bitcoin’s recovery from Monday’s $89,368 seven month low represents far more than a simple price rebound. It signals a fundamental shift in how capital is flowing through cryptocurrency markets, with institutional buyers strategically returning at support levels while retail traders finally capitulate. Understanding this dynamic reveals where real opportunities lie and it’s not where most people think.
The Real Story Behind Tuesday’s Bounce
When Bitcoin hit $89,368 on Monday, most observers focused on the headline: crypto’s worst week since March. But beneath the surface, market structure was fundamentally changing. Exchange inflows surged to 15,924 BTC in five days, nearly $1.5 billion worth. This wasn’t panic selling. This was distribution from long-term holders realizing losses while institutions accumulated strategically.
The distinction matters enormously. Panic selling creates cascading liquidations and psychological despair. Institutional accumulation at support levels plants seeds for recovery. What we witnessed was the latter phenomenon crystallizing the moment when smart money separates from emotional traders.
By Tuesday morning, Bitcoin had reclaimed $92,410 (+2.78% daily recovery), with Ethereum posting 5.52% gains. More importantly, the character of buying had shifted. Rather than short-covering or forced covering from liquidations, real demand emerged from reserve companies and institutional operators “buying the dip” at multi-month lows.
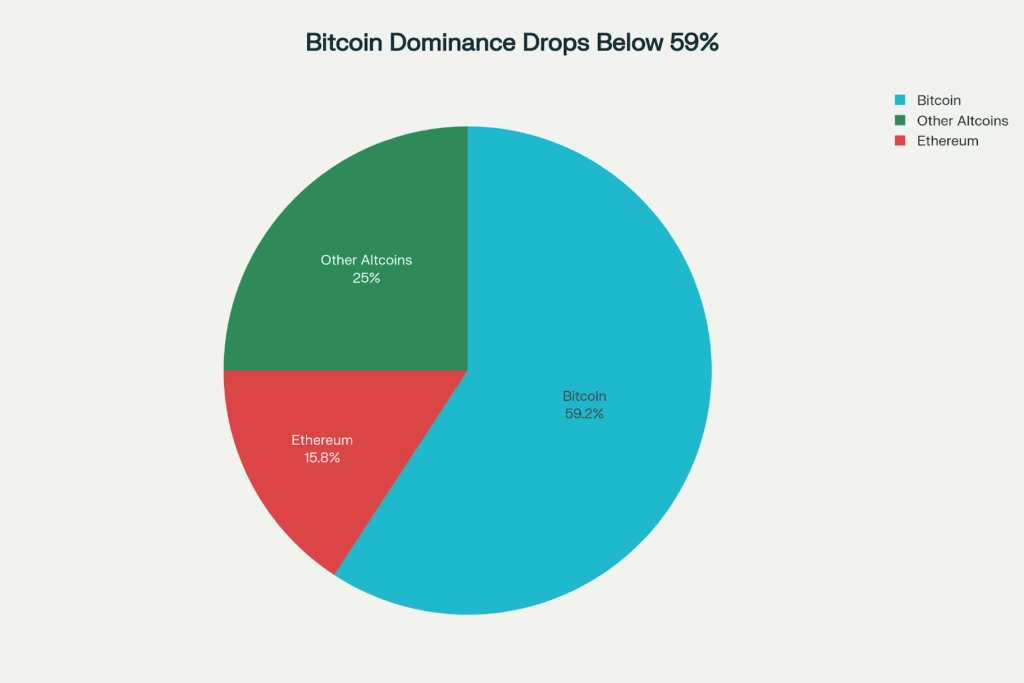
Bitcoin dominance breaks below 59% as capital rotates into undervalued altcoins following market recovery bounce
Capital Rotation: The Real Market Opportunity
Here’s what caught many traders off guard: As Bitcoin stabilized, something unexpected happened. Bitcoin dominance dropped below 59% down from 65% just six weeks ago. While Bitcoin recovered from extreme lows, altcoins outperformed it significantly. This pattern signals one thing clearly: capital isn’t returning uniformly across the market. It’s rotating.
Think of it as musical chairs where Bitcoin is the “safe seat” but investors are tentatively exploring other chairs first. When the largest, most liquid asset (Bitcoin) faces buyers at support, traders begin asking: “If Bitcoin is finding a bottom here, what about the beaten-down assets that haven’t recovered yet?”
This mathematical reality plays out in specific ways:
Layer 2 networks surged 3.78%, with Starknet posting a stunning 27% daily gain as developers recognized undervaluation in scalability solutions. CeFi tokens climbed 4.02%, led by WhiteBIT’s 21% jump after CEX platforms proved resilient during the liquidation cascade. AI tokens advanced 3.90%, as traders rotated into compute-focused projects that benefited from structural AI adoption trends despite short-term price pressures.
Meme coins led the parade with 4.38% sector gains seemingly irrational until you examine the pattern. Meme coins trade on pure sentiment; their 4.38% outperformance of Bitcoin’s 2.78% gain signals retail confidence returning after capitulation fear reading of 10 on the Fear & Greed Index.
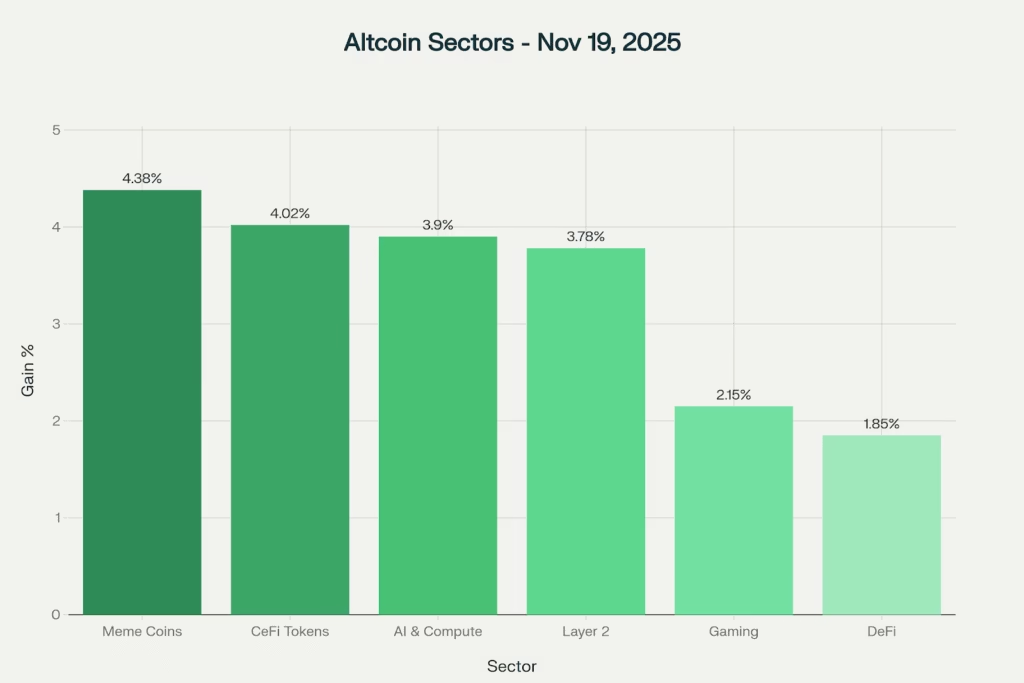
Altcoin sectors lead market recovery with meme coins +4.38% and CeFi tokens +4.02% as Layer 2 networks post 3.78% gains
The Psychology Shift: From Capitulation to Opportunism
The macro story behind this recovery reveals profound psychological shifts. Bitcoin spent six weeks declining from $126,521 to $89,368 a -29% crash that erased all 2025 gains. This wasn’t a gradual decline. It was a violent correction punctuated by two major liquidation cascades: the $19 billion wipeout following Trump’s China tariff announcement in October, and a fresh $3.1 billion cascade in mid-November.
By Monday’s lows, the Fear & Greed Index had crashed to 10 its lowest reading since February and near-record capitulation levels. Historically, readings this extreme precede powerful bounces. Why? Because at extreme fear levels, only hardened hands remain. Those who exit have already exited. Those who hold view price as opportunity rather than disaster.
Tuesday’s bounce came alongside revealing metrics: Long liquidations ($3.56B) vastly exceeded short liquidations ($558M). This imbalance suggests forced selling had largely completed. The market had cleansed itself of overleveraged longs. What remained were committed holders and emerging buyers.
This distinction explains the quality of Tuesday’s recovery. It wasn’t a dead-cat bounce (weak recovery before falling again). It was characterized by:
- Meaningful buying volume at the $90K psychological level
- Institutional reserve accumulation (not retail FOMO buying)
- Sector breadth, not just Bitcoin rallying, but 6 major altcoin sectors gaining
- Resilience in support levels when tested multiple times
What Traders Are Actually Doing Now
Market microstructure data reveals the transition occurring. During the crash, traders employed defensive strategies hedging with put options, reducing leverage, tightening stop-losses below support zones. By Tuesday, positioning shifted toward accumulation signals:
- Spot Bitcoin holdings increased rather than decreased at lower prices
- Put options at $85K, $80K, $75K strike prices remained bid—but not panic bids
- Funding rates on perpetual futures declined from negative to slightly positive, indicating balanced sentiment
- Trading volume ticked higher but without the frenzy characteristic of panic selling or FOMO buying
This balanced, thoughtful structure suggests professional participation returning systematically rather than explosive retail re-entry.
What Support Levels Actually Tell Us
Bitcoin’s hold of the $90,000 zone matters less for technical reasons than for psychological ones. The $90K level represents a psychological Maginot Line a point where both bulls and bears acknowledge “something important is happening here.” Analyst commentary from CoinSwitch Market Desk notes bulls are now “eyeing the $94,000 resistance zone,” suggesting 2-3% recovery potential in the immediate term.
More importantly, the $87,000-$88,000 zone beneath current levels represents genuine demand from the 2024-2025 accumulation phase. If Bitcoin breaks $90,000 decisively downward, institutional buyers have already telegraphed willingness to defend $87,000 aggressively. This creates a defined risk environment rather than bottomless selling.
The altcoin sector structure suggests this framework extends beyond Bitcoin. CeFi tokens, having proven operational resilience during liquidations and exchange runs, likely attract fresh allocation. Layer 2 networks offer genuine utility tailwinds independent of Bitcoin price Ethereum scalability development continues regardless of crypto cycle positioning. AI tokens benefit from structural adoption trends that multiyear crypto cycles cannot reverse.
The Pattern That Repeats
History shows a pattern. The 2018 bear market climaxed at 30 on the Fear & Greed Index. The COVID crash bottomed at 8. The FTX collapse registered 10. Every time Bitcoin recovered from these levels within 12 months, the rebound captured 100%+ returns. Current Fear & Greed reading of 10 (essentially identical to FTX capitulation) suggests similar recovery potential mathematically if historical patterns hold.
This doesn’t guarantee immediate profits. Bitcoin could trade sideways in the $90K-$98K range for weeks. But it does suggest present prices reflect maximum fear rather than maximum reality a distinction that separates opportunity from disaster in cryptocurrency markets.
What Matters for Your Portfolio Right Now
For Bitcoin holders: The $90K floor combined with institutional accumulation signals accumulation phase resumes if support holds. Patience rewarded those buying Bitcoin in February 2024 at $42,000. Current levels echo that dynamic.
For altcoin traders: Capital rotation into undervalued sectors (Layer 2 networks, AI tokens, CeFi) suggests 2-4 quarter outperformance potential as Bitcoin dominance continues declining from 59%. Winners won’t be random they’ll be tokens with genuine utility and development progress.
For macro observers: The crypto crash represented $1.2 trillion value destruction in six weeks. That destruction enabled $1.5 trillion in potential reallocation. Tuesday’s recovery bounce marks the beginning of that reallocation process, not its conclusion.
The story isn’t Bitcoin climbing from $89K to new all-time highs. That’s a headline everyone already expects. The real story is how capital redeploys once Bitcoin stabilizes which altcoin sectors capture rotation flows, which projects execute during the calm period, and which traders position ahead of the coming allocation phase.
Markets reward those who understand the mechanics of recovery, not just its occurrence.
Market Snapshot (November 19, 2025):
- Bitcoin: $92,410 (+2.78% 24h), defending $90K psychological support
- Ethereum: $3,226 (+5.52% 24h), leading major recoveries
- Market Cap: $3.21T (+2.3% 24h), capital stabilizing
- Bitcoin Dominance: 59.2% (down from 65% in October)
- Altcoin Dominance: 25% (rising, early capital rotation signals)
- Fear & Greed Index: 10-12 (extreme fear, historically bullish reversal setup)