The Day Crypto Markets Stood Still
Saturday, October 11th will be forever etched in cryptocurrency history as the day markets experienced their most devastating liquidation event ever recorded. What started as a routine trading session quickly devolved into absolute chaos when President Trump announced a shocking 100% tariff on Chinese tech imports, triggering a cascade of selling that wiped out $19.2 billion in leveraged positions and left 1.64 million traders liquidated in its wake.
Bitcoin, which had been confidently trading above $120,000 just days earlier, plummeted to a terrifying $101,000 low before finding its footing around $112,000. The speed and magnitude of the decline caught even seasoned traders off guard, with many comparing it to the infamous “Black Thursday” crash of March 2020 except this time, the destruction was nearly 20 times larger.
Bitcoin recovers from historic $19 billion liquidation event as markets digest Trump’s China tariff shock amid oversold conditions and institutional accumulation
Liquidation Apocalypse Numbers:
- Total Destruction: $19.2-40 billion liquidated (largest in crypto history)
- Traders Wiped Out: 1.64 million positions eliminated
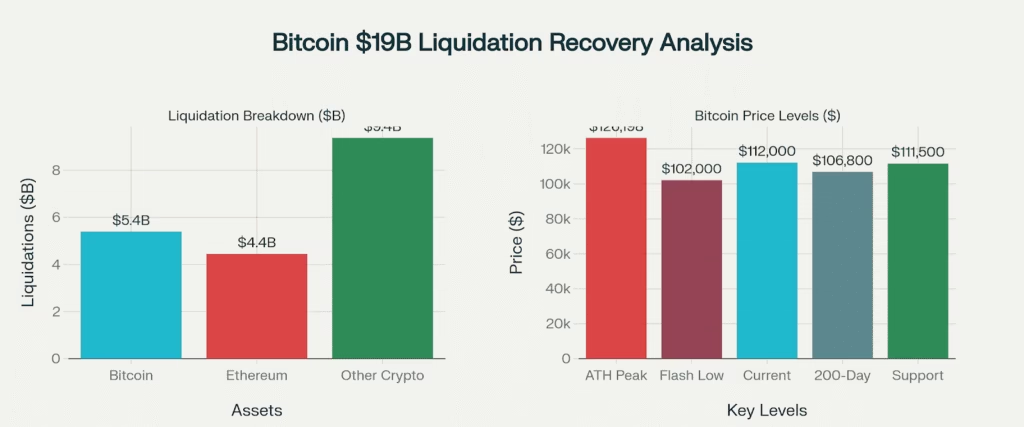
- Bitcoin Alone: $5.39 billion in BTC liquidations
- Flash Crash Low: $101,000 (briefly touched before recovery)
- Market Cap Loss: $560+ billion vanished in 24 hours

Major cryptocurrency tokens with a red downward arrow indicating a market crash or sell-off coingape
Trump’s Tariff Bombshell
The crypto carnage began when President Trump delivered an unexpected blow to global markets, announcing a 100% tariff on Chinese tech imports effective November 1st. This wasn’t just another trade dispute it signaled the potential start of a new, more aggressive trade war that sent shockwaves through every corner of the financial world.
What made this particularly brutal for crypto was Bitcoin’s growing correlation with traditional risk assets. With a 0.89 correlation to the S&P 500, Bitcoin had little choice but to follow equities lower when the index dropped 2.7%. The announcement caught markets completely off-guard, with many institutional players scrambling to reduce risk exposure across all asset classes.

economictimes
Geopolitical Shock Impact:
- Tariff Rate: 100% on Chinese tech imports
- Implementation: November 1st deadline
- Market Correlation: Bitcoin’s 0.89 correlation with S&P 500 proved fatal
- Risk-Off Mode: Global flight from risk assets
- Trade War 2.0: Renewed China-US tensions
“This isn’t a crypto crash, but rather a broad risk revaluation after a geopolitical shock,” explained Sasha from CoinMarketCap, highlighting how external factors beyond crypto’s control drove the selloff.
The Liquidation Machine Goes Berserk
What transformed a standard market correction into a historic catastrophe was the sheer volume of overleveraged positions that had built up during Bitcoin’s recent run to all-time highs. As prices began falling, automated liquidation systems kicked into overdrive, creating a feedback loop that accelerated the decline with ruthless efficiency.
The numbers are staggering: $16+ billion in long positions were forcibly closed, representing 94% of all liquidations. Ethereum traders weren’t spared either, with $4.44 billion in ETH positions evaporating. The largest single liquidation order exceeded $200 million, while over 1.6 million individual traders saw their positions wiped out completely.
Liquidation Breakdown:
- Long Positions: $16+ billion destroyed (94% of total)
- Ethereum Damage: $4.44 billion in ETH liquidations
- Largest Single Hit: $200+ million liquidation order
- Exchange Impact: Binance data may be underreported vs. actual damage
- Real Estimate: Some analysts believe actual liquidations reached $30-40 billion

Even more concerning, industry insiders suggest the official $19.2 billion figure might be just the tip of the iceberg. Crypto analyst MLM estimates actual liquidations could have reached $30-40 billion when accounting for all exchanges and unreported data.
The Technical Carnage and Recovery Signs
From a technical standpoint, Bitcoin’s crash below $110,000 shattered multiple support levels that traders had relied on for weeks. The break below $117,900 (38.2% Fibonacci retracement) and the 30-day moving average at $116,490 left many wondering if the bull market was over.
However, seasoned analysts point to several encouraging signs. Bitcoin managed to hold above its crucial 200 day moving average at $106,800, keeping the long-term uptrend intact. More importantly, the RSI plunged to oversold levels of 32 historically an area where significant bounces begin.
Technical Damage Assessment:
- Support Broken: $117,900 and $116,490 levels failed
- Bull Market Test: Still above 200-day SMA ($106,800)
- Oversold Signal: RSI at 32 suggests bounce potential
- Current Range: $110,000-$113,000 consolidation
- Next Resistance: $117,000-$120,000 zone for recovery
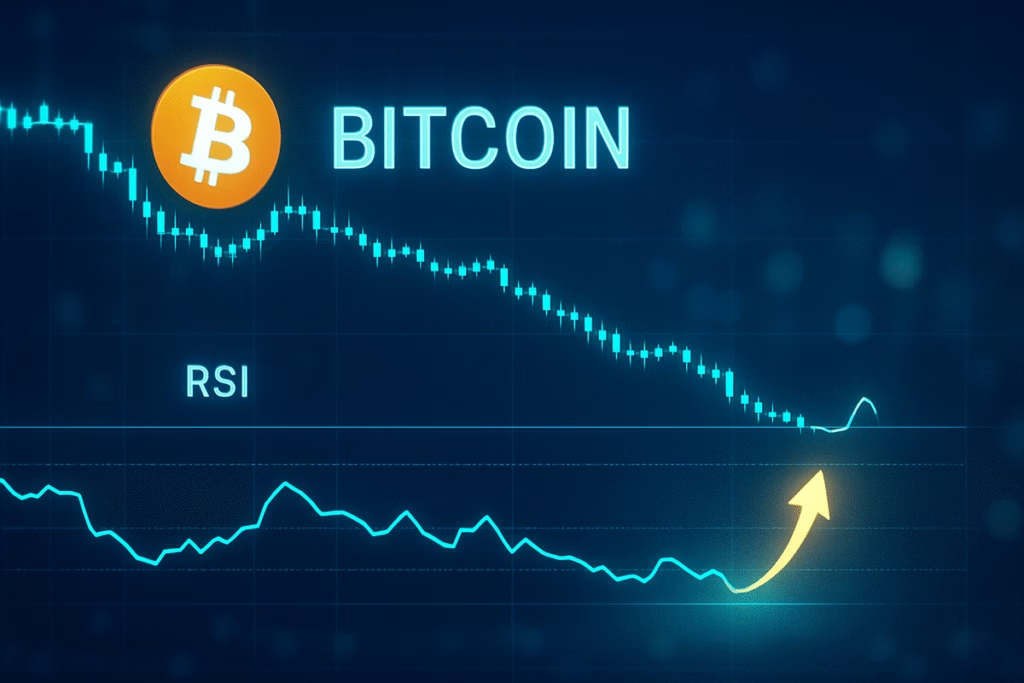
Bitcoin price chart showing RSI indicator signaling potential bounce from oversold territory markets.financialcontent
The fact that Bitcoin recovered from its $101,000 flash crash low to stabilize above $110,000 demonstrates underlying strength that shouldn’t be ignored, especially considering the magnitude of the external shock.
Altcoin Massacre: No Shelter from the Storm
While Bitcoin’s decline was severe, altcoins faced even worse destruction. Ethereum, which had been approaching $5,000 just days earlier, plummeted 12.7% to around $3,800. XRP experienced one of the worst performances, nosediving over 22% as traders fled to safety.
Even typically resilient tokens couldn’t escape the carnage. BNB dropped 6.6% despite the strength of the Binance ecosystem, while meme coins like Dogecoin fell 11%. The broad based nature of the decline showed that when panic strikes, few assets provide genuine shelter.
Altcoin Casualties:
- Ethereum: Down 12.7% to $3,800 (from $4,700+ highs)
- XRP: Crashed over 22% in the chaos
- BNB: Fell 6.6% despite ecosystem strength
- Dogecoin: Down 11% with other meme coins
The DeFi sector felt particular pain, with Total Value Locked dropping 11% to $147 billion as users rushed to reduce exposure to volatile assets.
Panic or Opportunity?
Despite the market chaos, institutional behavior suggests sophisticated money views this as an opportunity rather than a crisis. Bitcoin ETF assets under management remain near record highs at $161 billion, indicating long-term holders aren’t panicking despite short-term volatility.
Historical precedent supports this measured response. The March 2020 COVID crash, which saw much smaller liquidations of $1.2 billion, was followed by one of the most explosive bull runs in crypto history. Similarly, the FTX collapse liquidations of $1.6 billion ultimately created buying opportunities for patient investors.
Institutional Perspective:
- ETF Resilience: $161B AUM remains near records
- Smart Money: Institutions quietly accumulating during panic
- Historical Pattern: March 2020 crash preceded massive bull run
- Inflow Pause: Recent drop to $198M from $1.2B daily shows caution
- Long-term View: Structural demand intact despite volatility
“You wished you bought during the COVID crash. This is your COVID crash,” tweeted crypto analyst Quinten, highlighting the potential opportunity hidden within the destruction.
Historical Patterns Favor Recovery
Despite the carnage, historical data suggests October could still deliver positive returns for patient investors. According to economist Timothy Peterson’s analysis, October has traditionally been Bitcoin’s strongest month, with corrections often followed by rebounds of up to 21%.
The oversold conditions created by the liquidation event have reset market positioning, potentially clearing the path for a recovery as leverage is flushed from the system. With RSI at deeply oversold levels and key support holding above $108,000, conditions appear ripe for a technical bounce.
The Path Forward: Caution Meets Opportunity
As markets attempt to stabilize following history’s largest crypto liquidation event, the path forward depends heavily on several key factors. China’s response to Trump’s tariff announcement could either escalate tensions further or provide relief. Similarly, Monday’s ETF flow data will reveal whether institutional confidence remains intact.
From a technical perspective, Bitcoin needs to reclaim $117,000-$120,000 to signal that the correction is over. However, the fact that the cryptocurrency held above its 200-day moving average despite such massive external pressure suggests the underlying bull market structure remains intact.
Recovery Requirements:
- China Response: De-escalation could provide relief
- ETF Flows: Monday’s data will show institutional confidence
- Technical Reclaim: Need to break back above $117K-$120K
- Correlation Break: Reduced dependence on traditional markets
- Time Factor: Market needs time to heal from leverage destruction
While some analysts warn that breaking $100,000 could signal the end of the three-year bull cycle, others see this as a necessary reset that clears the path for sustainable growth. The coming days will likely determine which narrative proves correct.
Surviving the Unthinkable
October 11th’s $19 billion liquidation apocalypse will go down as one of cryptocurrency’s defining moments a day when external geopolitical forces combined with internal leverage excess to create the perfect storm. Yet Bitcoin’s ability to recover from a $101,000 flash crash and hold above crucial long-term support suggests the underlying bull market remains intact.
The scale of destruction was unprecedented, wiping out more capital in hours than the FTX collapse and COVID crash combined. However, history suggests these types of violent resets often create the foundation for the next major rally phase, as weak hands are eliminated and smart money accumulates at oversold levels.
As the crypto market enters a new phase, the lessons from October 11th are clear: leverage remains crypto’s double-edged sword, external macro factors can overwhelm internal dynamics, and survival often depends on maintaining perspective during moments of maximum fear. Whether this proves to be a buying opportunity or the beginning of a deeper correction will likely be determined in the weeks ahead.
For now, Bitcoin’s survival above $110,000 amid the largest liquidation event in crypto history stands as a testament to the cryptocurrency’s growing resilience and institutional foundation even when facing the unthinkable.
Historic Crash Summary:
- Liquidation Record: $19.2-40 billion destroyed (largest in crypto history)
- Trigger Event: Trump’s 100% China tariff announcement
- Bitcoin Low: $101,000 flash crash before recovery to $112,000
- Market Recovery: Oversold conditions and institutional accumulation provide hope
- Bull Market Test: 200-day SMA held despite unprecedented external shock
Related Coverage: