
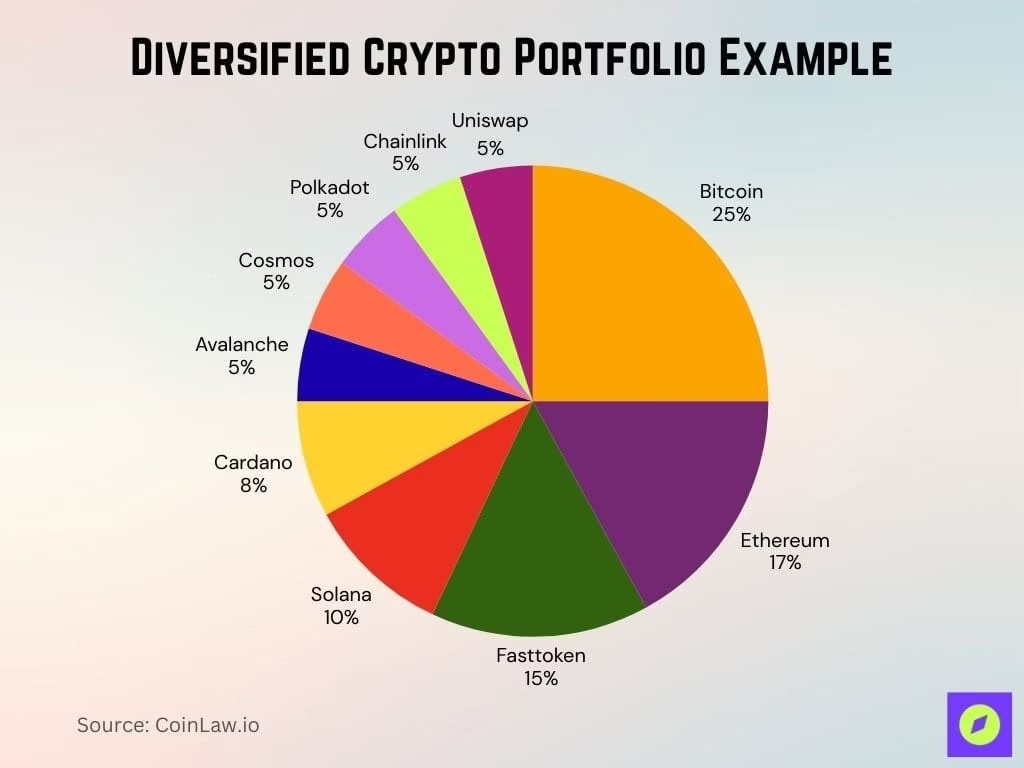
Cryptocurrency in Investment Portfolios Statistics 2025
Through the first half of November, cryptocurrency markets experienced the kind of turbulence that separates temporary price fluctuations from structural market transitions. Bitcoin fell from its November 4 peak of $126,521 toward lows near $85,000 before beginning to recover toward $88,200 by late Tuesday. This movement wasn’t random volatility it represented the exact moment when professional capital allocation displaced retail panic across digital asset markets, fundamentally altering who controls pricing and where the next significant move likely emerges.
The mechanics of this transition reveal why understanding market structure matters far more than obsessing over individual price points. While headlines focused on Bitcoin trading ranges, the real story unfolded in how different categories of market participants behaved during weakness and what their actions signal about coming market phases.
The Mechanics Behind Market Structure Shifts
When Bitcoin plunged toward $85,000, two competing behaviors created the foundation for what would follow. Retail investors holding Bitcoin through ETF products experienced daily pricing updates showing substantial unrealized losses. For many, those visible daily declines triggered redemptions and selling decisions driven by emotional responses to market movement. Meanwhile, institutional allocators operating through over the counter desks and direct custody channels evaluated the same price declines through an entirely different framework.
Professional money managers assessed that the speed and violence of the decline dropping $41,000 in approximately two weeks had likely cleared excessive leverage from derivatives positions. This represents the mechanism through which volatile corrections self-correct. When prices fall fast enough, leveraged traders face forced liquidations that accelerate selling until all margined positions unwind. Once that forced-selling cascade completes, natural demand begins emerging from participants willing to accumulate at depressed valuations.
The data captured this transition precisely. ETF products experienced cumulative withdrawals totaling over $2.4 billion from late October through mid-November as retail participants exited positions at losses. Simultaneously, direct institutional acquisition accelerated, with BitMine Immersion Technologies, MicroStrategy, and corporate treasuries accumulating Bitcoin at rates exceeding any comparable period in 2025. The bidirectional flows created an apparent contradiction: assets flowing out of public funds while institutional buyers aggressively accumulated.
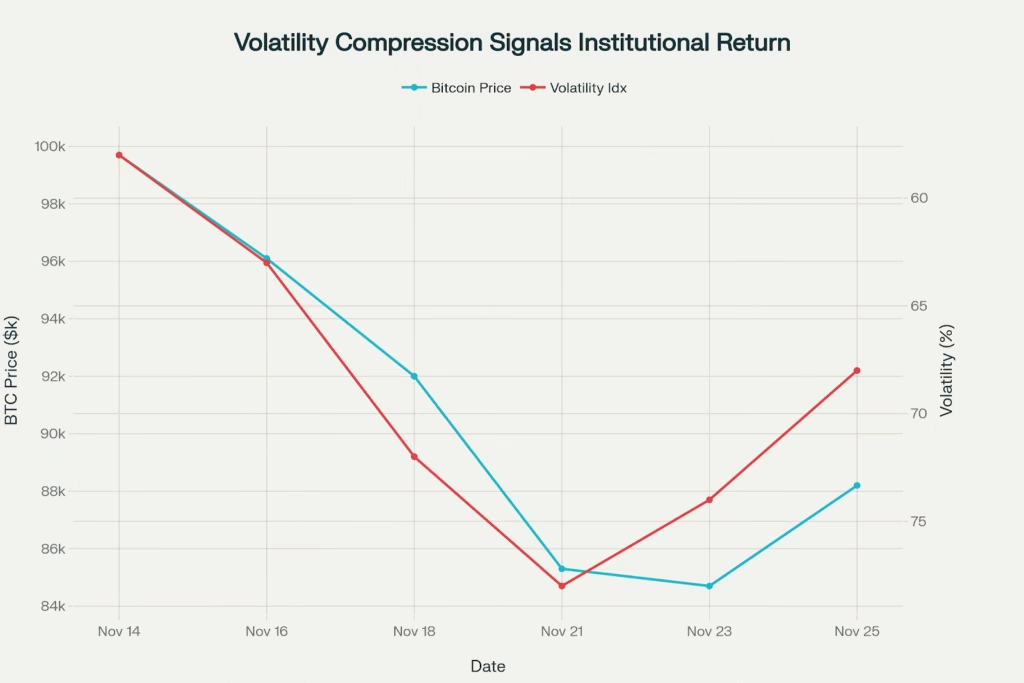
Bitcoin recovers to $88.2K as market volatility declines from 78% peak, indicating institutional capital returning after forced selling completion
This divergence persists because institutional capital and retail positioning operate on entirely different timescales. Retail investors react to market information quickly, sometimes trading daily based on news and price movement. Institutions execute multi-quarter plans that treat week to week volatility as noise rather than signal. When these timescales reach opposite extremes simultaneously, retail panic meeting institutional accumulation markets typically experience rapid reversals.
What November’s Volatility Peak Revealed
Bitcoin ‘s volatility index reached 78% on November 21 when the flash crash drove prices toward $80,500 on Hyperliquid’s decentralized exchange. This volatility reading, while elevated, remained below the 85-90% levels that characterize true panic-selling environments. More significantly, volatility has already compressed from that peak toward 68% by Tuesday, November 25.
This contraction matters because it signals that the most extreme forced-selling pressure has subsided. When volatility expands during crashes, it reflects growing uncertainty and cascading liquidations. When volatility contracts during price recoveries, it indicates that buyers and sellers have established relatively balanced positioning. The market transitions from one-directional selling into two-way price discovery.
Ethereum exhibits similarly constructive dynamics, with trading volume recovering to $27 billion daily, the highest levels since the October rally. Volume expansion accompanying price recoveries (rather than crashes) indicates accumulation driven moves rather than panic bounces. Participants willing to transact size at higher prices after declines display conviction that current valuations represent genuine opportunities rather than temporary relief.
The Regulatory Backdrop Nobody’s Fully Crediting
Throughout November’s turbulent price action, the fundamental regulatory environment for cryptocurrency actually improved markedly. The SEC launched “Project Crypto” on November 12, introducing the most comprehensive regulatory framework for digital assets in the agency’s history. Rather than continuing “regulation by enforcement,” the SEC established clear asset classification criteria that provide certainty for compliant participants.
Simultaneously, the CFTC expanded its regulatory jurisdiction, and the Federal Reserve rescinded banking guidance that had previously chilled institutional participation in crypto custody and services. These developments represent precisely what institutional allocators require before committing large capital: clarity about regulatory compliance pathways and reduced legal uncertainty around participation.
The fascinating element is that institutional adoption continued accelerating despite price weakness. The Alternative Investment Management Association’s latest survey found that 55% of traditional hedge funds now maintain cryptocurrency exposure, up from just 47% in 2024. Critically, 71% of surveyed funds plan to increase allocations over the next 12 months, a statistic that contradicts narratives about institutional retreat.
Family offices, multi-family offices, and high-net-worth individuals remain the primary allocator base, but participation from funds-of-funds has expanded substantially. Tokenization initiatives are advancing, with one-third of hedge funds actively exploring blockchain-enabled fund structures. This infrastructure development would never proceed if institutions viewed crypto as a temporary bubble.
Why Altcoins Outpacing Bitcoin Tells the Recovery Story
The performance leadership of altcoins during late November’s rebound provides the clearest signal that market structure recovery is advancing. XRP surged 8%, Sui jumped 11%, and smaller-cap tokens posted 4-6% gains while Bitcoin managed 1.8% recovery. This pattern emerges consistently during early recovery phases when forced selling has completed and capital rotates from defensively-positioned holdings into opportunistically-valued alternatives.
Bitcoin dominance (the percentage of total crypto market capitalization allocated to Bitcoin ) has declined from 61% toward 57.8%, reflecting this rotation. Historically, declining Bitcoin dominance during the recovery phase after corrections predicts strong altcoin performance for the subsequent 3-6 months. When large cap assets stabilize while smaller caps rally, it indicates capital reallocation toward higher-risk-reward propositions, something that only occurs after panic has truly subsided.
The Technical Setup Establishes Clear Risk-Reward Parameters
Bitcoin has formed what technical analysts identify as a pin bar candle, a pattern where price falls sharply before recovering most losses on strong closing volume. This formation occurs when sellers exhaust available liquidity, forcing a reversal once new demand emerges. The $82,500-$85,000 zone where this pattern formed attracted repeated institutional purchasing, with order book data showing massive bids refreshing at lower prices rather than getting pulled.
Current price structure creates defined scenarios that guide positioning decisions. Bitcoin trading around $88,000 sits exactly 3.5% above support levels where institutional buyers appeared throughout the decline. Breaking above $91,000 would establish a higher low compared to November lows, confirming that selling pressure has given way to buying interest. Conversely, breakdown below $84,500 would negate the recovery thesis and likely accelerate selling toward $80,000-$75,000.
The binary nature of this structure isn’t weakness, it’s opportunity. Uncertainty during market transitions enables disciplined traders to establish positions with defined risk parameters. Those betting on recovery can establish long positions with stops below $84,000 and targets above $92,000. Those maintaining defensive positioning can await clearer confirmation above $91,000 before increasing exposure. Everyone works with explicitly defined risk levels.
The Path Forward Depends on Macro Policy, Not Crypto Developments
Federal Reserve communications will ultimately drive the next significant move more than any on-chain metric or adoption announcement. December rate cut probability has moved from 41.8% two weeks ago toward 77% by Tuesday, reflecting changing expectations about Fed policy direction. If these rate cut probabilities materialize into actual policy decisions, risk asset rallies typically accelerate as investors reduce discount rates applied to future cash flows across all asset classes.
Conversely, if Fed officials reverse course and signal continued rate tightening, Bitcoin would likely surrender the recovery gains and test lower support levels. This macro dependency reveals how fully Bitcoin has integrated into broader portfolio frameworks. Digital assets no longer trade based primarily on internal cryptocurrency narratives. They trade based on macroeconomic expectations that drive risk appetite across all markets.
The next 4-6 weeks will clarify Fed intentions through economic data releases and official communications. This period represents a watching-and-waiting phase for most market participants. Institutional allocators have already positioned aggressively at lower prices. Retail investors remain shellshocked from November’s volatility. The outcome depends not on what crypto developers build or regulators announce, but on what Federal Reserve officials decide about interest rate policy.
What This Moment Means for Positioning
Bitcoin at $88,200 represents fundamentally different market conditions than Bitcoin at $88,200 under different circumstances would. The current setup features completed forced-selling cascades, compressed volatility, accelerating institutional accumulation, improving regulatory clarity, and strong tokenization interest. These characteristics typically precede significant appreciation phases, though timing remains uncertain.
For those maintaining conviction in cryptocurrency’s long-term trajectory, November’s volatility cleared excessive leverage while institutional accumulation advanced positions ahead of a likely policy pivot. For those lacking exposure, waiting for clearer confirmation above $92,000 reduces timing risk while preserving optionality. Everyone benefits from acknowledging that market structure has shifted from retail panic toward institutional positioning and that this shift historically creates the conditions for sustained reversals.
Tuesday Update (November 25, 2025):
- Bitcoin: $88,229 (+1.67% daily), recovering from $85,351 lows after institutional accumulation accelerates
- Ethereum: $2,953 (+0.74% daily), building trading volume infrastructure recovery
- Market Volatility: Declining from 78% peak toward 68%, signaling panic subsidence
- Institutional Adoption: 55% of hedge funds now maintain crypto exposure, up from 47% prior year
- ETF Activity: Net outflows continue but magnitude declining as retail panic wanes
- Technical Setup: Pin bar formation at lows, recovery confirmation pending $91K break